'%20stroke-width='82'%20stroke-linecap='round'%20stroke-linejoin='round'%20/%3e%3cpath%20d='M%20345%20200%20L%20360%20130%20L%20405%20200%20Z'%20fill='url(%23zenboost-gradient)'%20/%3e%3c/svg%3e) Zenboost
ZenboostYour starting point, on one page
Overview analyses your website and your online presence, then returns a digital maturity score, your real strengths, your blind spots and the levers to pull first. It is the document you show your leadership team or your colleagues to align everyone in five minutes.
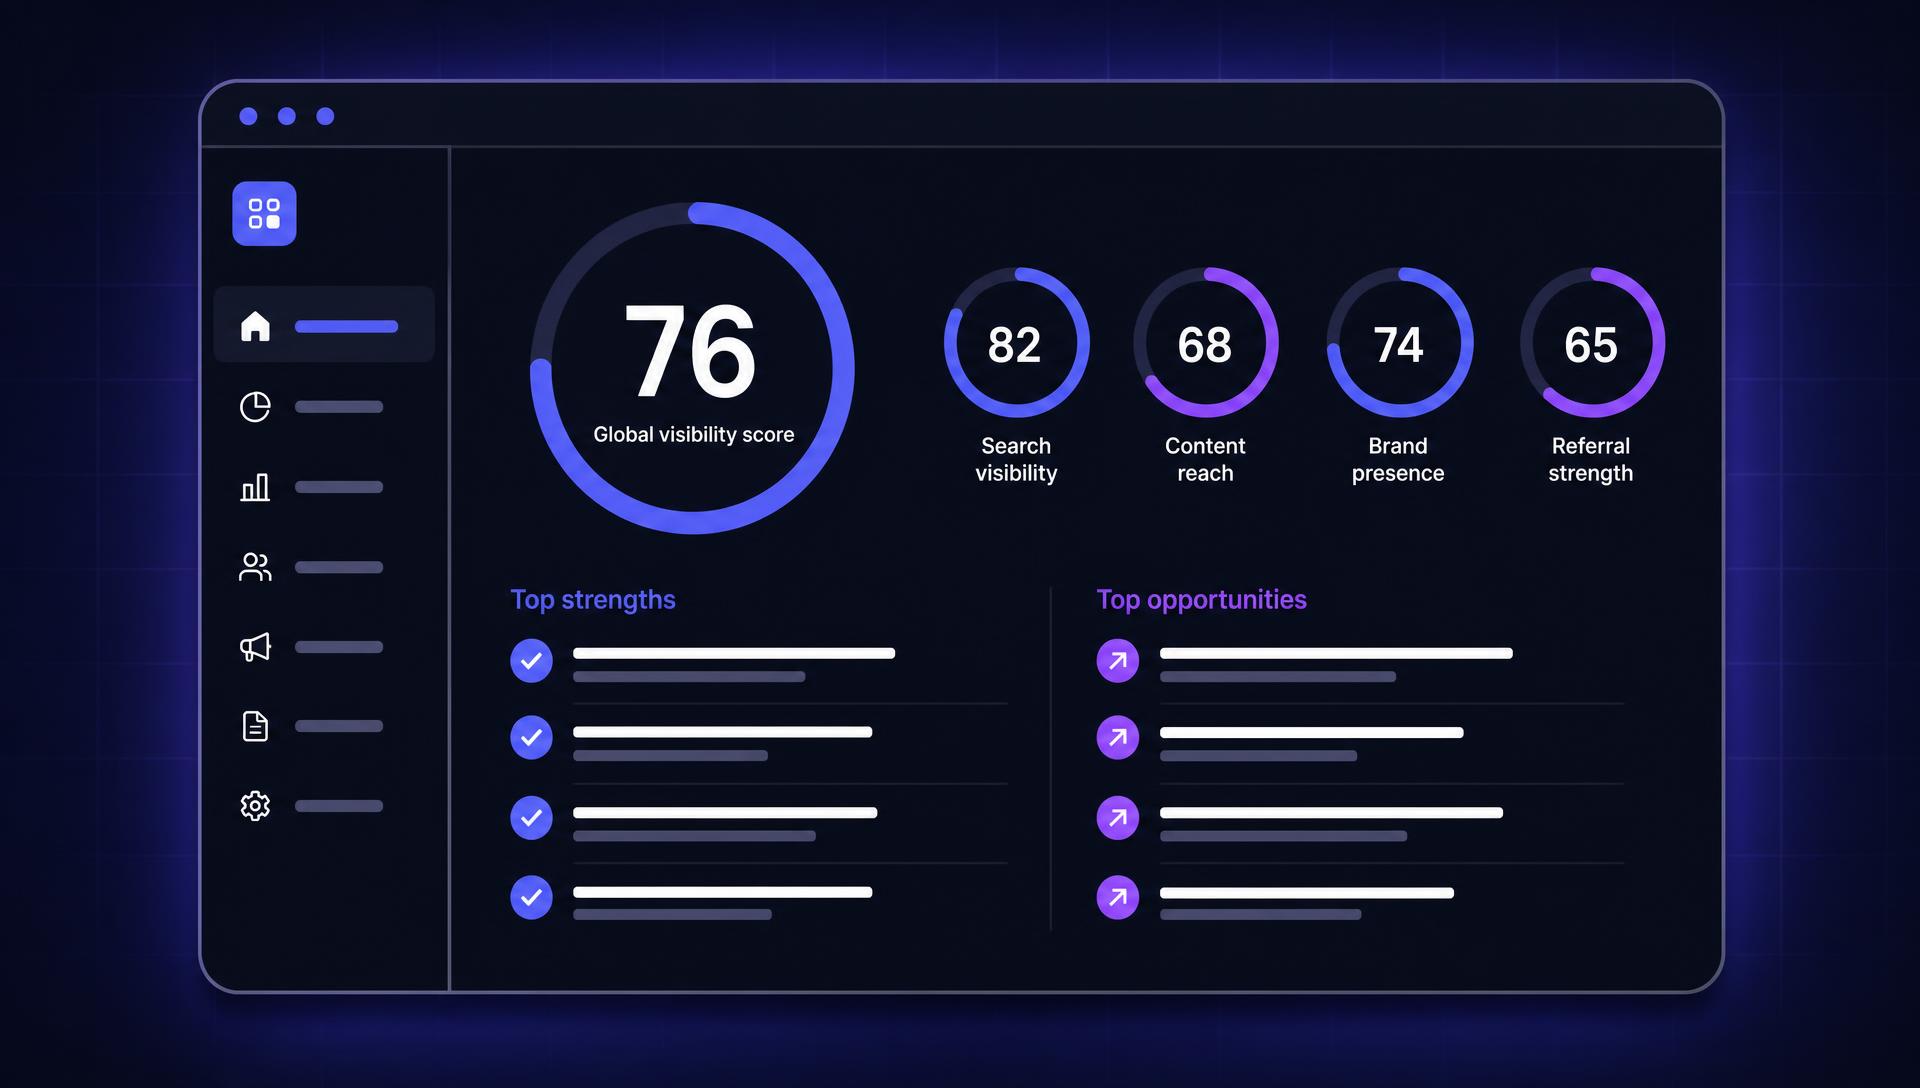
What you get
A weighted score across the dimensions that actually matter in B2B: website, content, social presence and engagement. A number you can track over time instead of a gut feeling.
A summary infographic covering your positioning, key messages and opportunities. Ready to share in a leadership meeting or export to PDF.
What already works and deserves amplification, next to what genuinely holds you back. Every point is backed by something observed on your site or your online presence.
Levers ranked by impact, so you know what to tackle this week rather than in six months.
The detail behind the global score: where you fall short, where you already perform, and by how much.
The same page works as an internal brief, a meeting deck and the starting point of your Roadmap.
How it works
- 01Zenboost analyses
You enter your website address. Zenboost crawls your key pages — home, offer, pricing, blog, references — then completes the picture with your online and social presence.
- 02Zenboost reports
The collected signals become a weighted score, a summary infographic and a list of strengths, blind spots and priorities. No jargon.
- 03You decide
Share the page, settle the priorities, then move on to the other 360° Scan modules and to the Roadmap that executes those decisions.
The summary infographic condenses the diagnosis onto a single page: score, positioning, key messages and priorities. It is the format that wins the meeting, because nobody needs an explanation to read it.
See a real exampleWhy you can trust this
A score, not a feeling
You get a weighted score across the dimensions that matter in B2B — website, content, social presence, engagement — recalculated the same way on every scan. Progress becomes something you can track across quarters instead of something you sense.
A repeatable method, not an opinion
Zenboost crawls your key pages — home, offer, pricing, blog, references — then completes the picture with your online presence. The per-category detail stays under the global score, so you can see exactly what pushed it up or down.
Nothing at risk in trying it
The first analysis is free, with no credit card, no commitment and nothing to install on your website. Your data is used only to produce your Overview: never resold, never used to train public models.
Built for a B2B SME
The summary is written in your language, jargon-free, ready to present to leadership without prior expertise. Every strength and blind spot comes with the matching priority you can add to your Roadmap.
What it is for, concretely
Frequently asked questions
- How is the maturity score calculated?
- It aggregates several weighted dimensions — website clarity and quality, blog and content, LinkedIn presence and real engagement on your posts. The per-category detail sits right under the score, so you can see exactly what pulls it up or down.
- Do I need to install anything on my site?
- No. Zenboost works from your public pages and your online presence. No code to add, no analytics access to grant.
- Is Overview available on the free plan?
- Yes, Overview is part of what you see from the free analysis. The deeper 360° Scan modules and the full Roadmap unlock with a paid plan.
- Can I export the result?
- Yes. The infographic and the sections you select export to PDF, and a read-only public link lets you share the plan without asking anyone to create an account.
Analyse my company
Enter your website address: your Overview is generated within minutes.
Use the full form instead